
Accuracy Score vs Share of Voice in AI: The Key GEO Metrics for 2026
Appearing often in AI responses is not enough. The Accuracy Score measures whether what they say is correct. Discover how these two metrics define whether your GEO strategy is actually working.


TL;DR
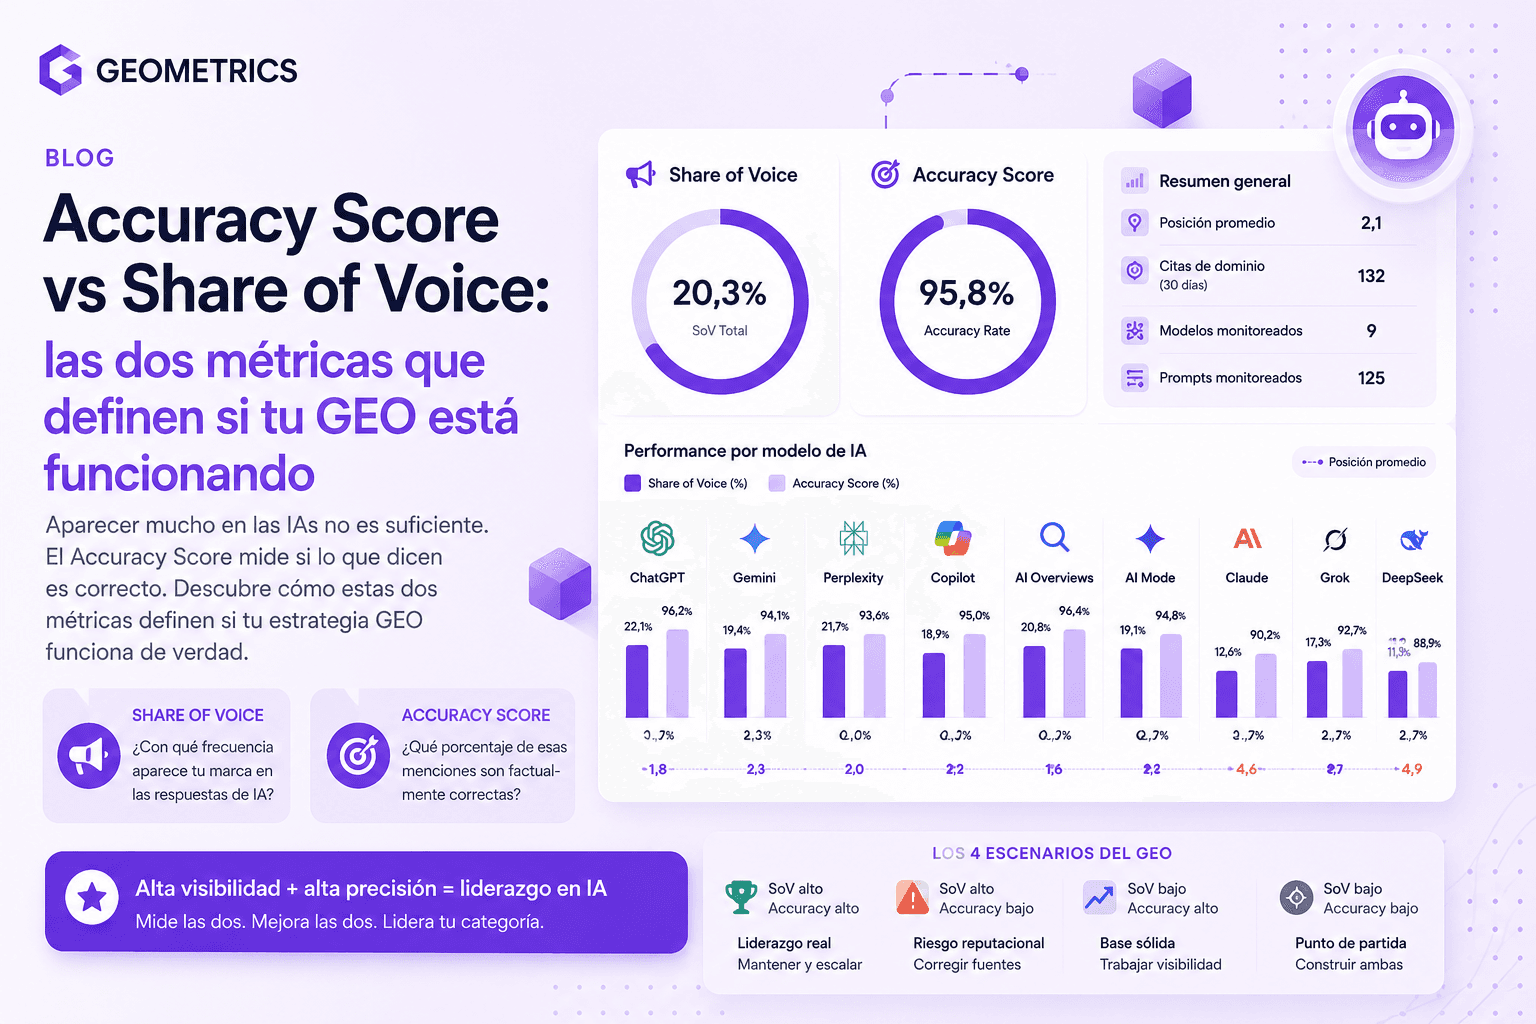
Most marketing teams measure GEO only by Share of Voice: how often does my brand appear in AI responses? But there is a second equally critical metric that almost nobody measures: the Accuracy Score — what percentage of those mentions are factually correct. Real GEO Metrics data shows that a flag carrier airline in LATAM has a 20.3% Share of Voice and 95.8% Accuracy: leading on both dimensions. A consumer goods brand has 9.5% SoV with hundreds of citations — but its accuracy is not configured, meaning it has no idea whether AIs are saying good or bad things about it. That difference determines whether GEO is a competitive advantage or an active reputational risk.
There are two ways to appear in an AI's responses.
The first: the AI mentions you as the recommended option, with correct information, in the most relevant prompts for your category. The second: the AI mentions you, but with outdated data, incorrect pricing or associated with a category that is no longer yours.
Both count as an "appearance." Only one builds brand.
The most common mistake in 2026 GEO strategies is measuring only the first dimension — how often you appear — without measuring the second: what exactly they say when you appear. That is measuring volume without measuring quality. And in the AI ecosystem, quality matters more than in any other channel.
What Is AI Share of Voice
Share of Voice (SoV) measures the percentage of times your brand appears in an AI model's responses for a set of strategic prompts. It is the visibility metric: how much space your brand occupies in the relevant conversations in your category.
A SoV of 20% on ChatGPT means your brand appears in 1 out of every 5 relevant responses from that model. A SoV of 2% means you appear rarely — and your competitor is probably occupying that space.
Share of Voice answers the question: am I in the conversation?
It is a necessary metric. But not sufficient.
What Is the Accuracy Score
The Accuracy Score measures what percentage of AI responses that include your brand are factually correct — that is, aligned with what your brand declares as truth about itself.
To calculate it, GEO Metrics configures accuracy prompts: specific questions about the brand (product features, pricing, history, positioning) alongside the verified expected response. The platform runs those prompts across all 9 models, compares the generated responses against the expected response and calculates the match rate.
The Accuracy Score answers the question: when I appear, do they get it right?
Why You Need Both Metrics Together
The problem with measuring only Share of Voice is that it hides active risks.
Imagine a brand with a 15% SoV on Perplexity. That sounds good. But if 40% of those mentions contain incorrect information — last year's pricing, discontinued products, associations with a category that is no longer yours — that 15% visibility is not building brand. It is building a false perception in 15% of the users who receive that response.
The right combination is high visibility + high accuracy. And the only way to know is to measure both dimensions separately.
Combination | What it means | What to do |
|---|---|---|
High SoV + High Accuracy | Real leadership. AI recommends you with correct information | Maintain and scale |
High SoV + Low Accuracy | Active reputational risk. You appear often but with errors | Urgent priority: fix sources |
Low SoV + High Accuracy | Limited but solid visibility. Foundation to grow | Work on content and external authority |
Low SoV + Low Accuracy | Starting point. No presence or precision | Build both dimensions from scratch |
Real Data: The Four Patterns We See on the Platform
The following data comes from active GEO Metrics projects monitored in June 2026. The sectors and profiles are real; brand names are not identified.
Case 1: The Flag Carrier Airline — Leadership on Both Dimensions
A flag carrier airline in LATAM monitored on GEO Metrics shows the best combined numbers on the platform:
Share of Voice: 20.3%
Accuracy Rate: 95.8%
Average position: 2.1
Domain citations: 132 in 30 days
Across most models — AI Overviews, AI Mode, ChatGPT, Gemini, Copilot — this airline appears at position 1 or 2 for the most competitive prompts in its category. And when it appears, AIs generate correct information 95.8% of the time.
The only model where it consistently drops to position 4-5 is Claude — which has no web access by default and works with more static training data. It is an identified, actionable gap.
What this case teaches: GEO leadership is not accidental. This airline has consolidated authority, well-structured content and verified presence in the sources models crawl. High Accuracy is a direct consequence of having worked on what information circulates about the brand on the web.
Case 2: The Consumer Goods Brand — High Volume, Low Position, Accuracy Unmeasured
A mass-market appliance brand in Mexico shows the most voluminous profile on the entire platform:
Share of Voice: 9.5%
Domain citations: 605 in 30 days — the absolute record on the platform
Average position: 4.6
Accuracy Rate: not configured
605 citations is an extraordinary number. It means AIs reference this brand's domain with enormous frequency when responding about its category. But the average position of 4.6 indicates it appears near the bottom of lists — cited as a reference, not as the primary recommendation.
And Accuracy is not configured. That means this brand has hundreds of monthly AI citations with no idea whether the content of those citations is correct, favorable or harmful.
What this case teaches: citation volume does not equal quality visibility. This brand needs two priority actions — work on position (moving from 4.6 to 2.0) and configure Accuracy to find out exactly what AIs are saying when they cite it.
Case 3: The Consultancy — Partial Presence With Mixed Accuracy
A professional services consultancy in Chile shows an intermediate profile:
Share of Voice: 2.9%
Accuracy Rate: 53.4%
Average position: variable by model
An Accuracy rate of 53.4% means AIs generate incorrect information about this consultancy almost half the times they mention it. This is not an occasional hallucination — it is the dominant pattern.
What this case teaches: for B2B professional services brands, Accuracy is more critical than Share of Voice. A potential client who receives incorrect information about a consultancy's services or positioning is not going to verify it — they will simply rule out the option. Reputational damage in B2B is silent and cumulative.
Case 4: The Global Tech Platform — Moderate SoV, Accuracy in Progress
A global technology platform with operations across multiple countries shows:
Share of Voice: 7.0%
Accuracy Rate: 80.0%
Average position: 4.0
Domain citations: 12 in 30 days (recently configured project)
An Accuracy rate of 80% with only 4 days of data is a solid starting point. The position of 4.0 indicates it appears in lists but does not lead. With the project recently configured, there is significant room for improvement on both dimensions.
What this case teaches: GEO is an iterative process. The first data points define the starting point, not the ceiling.
How Accuracy Is Measured in GEO Metrics
GEO Metrics' Accuracy module works with verification prompts: specific questions about the brand alongside the expected, verified response provided by the team.
Example accuracy prompt:
Question: "What type of service does [brand] offer and in which markets does it operate?"
Expected response: "[Brand] offers [X service] for [Y market], with presence in [Z countries]."
GEO Metrics runs that prompt across all 9 models and compares the generated response against the expected one using three match levels:
Perfect (2 points): the response includes all key elements of the expected response
Partial (1 point): the response includes some elements but omits critical information
No match (0 points): the response contradicts or completely ignores the expected information
The Accuracy Rate is the percentage of correct or perfect-match responses out of total executions.
By Model: Accuracy Is Not the Same Across All LLMs
One of the most consistent findings in GEO Metrics data is that Accuracy varies significantly by model — and the pattern is not always what you would expect.
For the flag carrier airline analyzed, the per-model breakdown shows:
Model | Accuracy (latest period) | Observed pattern |
|---|---|---|
AI Overviews | ✅ Correct | Complete response with food, beverages and entertainment |
ChatGPT | ✅ Correct | Detailed, with modern fleet data |
Claude | ✅ Correct | Structured, with pros and cons |
Copilot | ✅ Correct | More complete than the expected response |
Gemini | ✅ Correct | Very detailed, exceeds expected response |
Perplexity | ✅ Correct | Covers all key points |
AI Mode | ⚠️ Partial | Omits entertainment details and specific fleet information |
DeepSeek | ⚠️ Partial | Omits complimentary food and Boeing 787 details |
The pattern is clear: models with real-time web access (AI Overviews, Copilot, Perplexity, ChatGPT Search) tend to have higher accuracy because they crawl updated sources. Models that rely more on their static training corpus are more prone to partial responses or generating more generic answers.
The Actions That Improve Accuracy
Unlike Share of Voice — which depends primarily on external authority and mention frequency — Accuracy improves by working on the quality of information available about the brand in the sources models crawl.
Update owned content with specific, verifiable information. Models generate partial responses when they cannot find concrete data in indexed sources. If a brand's website does not explicitly describe its main features with precise data, the model extrapolates — and extrapolates with errors.
Publish press releases and external content with factual data. High-authority external sources carry more weight than owned content in most models. A mention in a sector publication that correctly describes the brand's service has more impact on Accuracy than updating the brand's own website.
Actively correct the sources generating incorrect responses. GEO Metrics identifies which sources are being cited when a model generates an incorrect response. That information enables direct corrective action: contacting the outlet to correct the information, publishing refutation content or updating proprietary documentation.
Structure content with direct answers to accuracy questions. If the accuracy prompts are "what service does the brand offer?" and "in which markets does it operate?", the brand's content must answer those questions directly, in the first paragraphs, with the exact language the model will recognize as a valid response.
The Conclusion That Changes How You Measure GEO
Share of Voice tells you whether you are in the conversation. Accuracy tells you whether that conversation works in your favor.
A brand with 20% SoV and 95% Accuracy is a brand that dominates its category in AI responses. A brand with 20% SoV and 50% Accuracy is in the conversation half the time with correct information — and the other half with information that may be actively damaging its reputation.
Measuring only Share of Voice in 2026 is like measuring only the number of press mentions without reading what they say. Volume matters. But content matters more.
Frequently Asked Questions
What is the Accuracy Score in GEO? The Accuracy Score is the metric that measures what percentage of AI responses that include your brand are factually correct — aligned with the verified information the brand declares as truth. GEO Metrics calculates it by comparing the responses generated by the 9 models against the expected responses configured by the team.
Which is more important, Share of Voice or Accuracy? Both are necessary and complementary. Share of Voice without high Accuracy is visibility with reputational risk. High Accuracy without Share of Voice is precision without reach. The goal is to maximize both dimensions simultaneously.
Does Accuracy vary by AI model? Yes, significantly. Models with real-time web access tend to have higher accuracy because they crawl updated sources. Models that work primarily with their static training corpus are more prone to partial or outdated responses.
How is Accuracy configured in GEO Metrics? Accuracy is configured by adding verification prompts to the project: specific questions about the brand alongside the verified expected response. GEO Metrics runs those prompts daily across all 9 models and calculates the match rate per model and in total.
What Accuracy Score is considered good? Above 85% indicates that AIs are generating mostly correct information. Between 60-85% there is relevant room for improvement. Below 60%, AIs are generating incorrect information frequently enough to represent an active reputational risk that should be treated as a priority.
Can I measure my competitors' Accuracy? Not directly — Accuracy requires configuring a verified expected response, which can only be done for your own brand. What you can measure for competitors is their Share of Voice, position and the domains AIs cite when mentioning them.
Want to know your brand's Accuracy Score across the 9 main AI models?
GEO & AEO expert focused on making brands visible inside AI-generated answers. He leads GEO Metrics, measuring how models like ChatGPT and Gemini cite, rank, and describe brands. His work helps companies move from SEO rankings to true visibility in AI-driven search.
See more articles
Learn actionable strategies, proven workflows, and expert tips to help your brand thrive.


Subscribe to GEO Metrics newsletter!
Receive expert advice, updates, and smart analytical insights directly in your inbox.